Friday, 10 August 2012

Battle of the benchtops part II (you'll need a strong bench for one of these!)

After the furore around the Loman et al paper it is interesting to read another comparison of NGS platforms. Lets face it most of us want to know either what we should be buying next, or if we bought the right thing in the first place.

Comparison papers help.

As do beers at AGBT!

The latest sequencer comparison paper: Mike Quails group at the Sanger published a comparison of PGM, MiSeq and PacBio (interesting choice of the third platform). They sequenced several small genomes that varied massively in GC content. It was interesting to me that these genomes are the routine test genomes for Mikes group, most of us would shudder if a user asked us to sequence something with 20% GC on HiSeq!

Table 1 is excellent reading and should help people in making purchasing decisions. Collecting all this information together needs to be done by each individual institute as prices can vary quite widely. But the table as it stands should allow anyone to make basic comparisons and also see what is missing that they might need to put greater effort into. In the paper they say that although the raw error rate is significantly different for the instruments compared, the affect on SNP calling is negligible given sufficient coverage. 15x appeared fine for the genomes tested. I’d prefer to have seen this in the table as well, to act as a counter to claims around error rates from sales people! They compared most of the things you would want to when deciding what to buy (see the table for everything). The sequencing costs differ significantly per Gb at $500, $1000 and $2000 for MiSeq, PGM 318 and PacBio respectively. This compares to about $50 per GB on HiSeq.


Table 1 from the paper
Most people considering PGM or MiSeq are after a fast sequencer and both will deliver. As we get used to sub-24 hour run times our users will notice how long library prep takes. As costs for sequencing continue to fall we’ll also spend more time questioning the costs of library prep. The paper talked about the push from all companies to make library prep as simple as possible. However there was no mention on the cost of library prep. The genomes sequenced require only ?-? Gb of data and so ??? libraries would be needed per run. At $100 per sample the cost is X?times more than the sequencing. This is still an unmet need of the community, $1 sample prep for $10 genomes.

How did they do the comparison: Genomes sequenced included Bordetella pertussis (68% GC), Salmonella Pullorum (52% GC), Staphylococcus aureus (33% GC) and Plasmodium falciparum (19% GC). They made PCR-free or PCR amplified libraries for MiSeq PE150bp runs, or HiSeq PE75bp lanes allowing a direct comparison of the impact of PCR. Additionally they prepared Nextera libraries from three of the genomes sequenced (Bp, Sa & Pf) and whilst two produced “remarkably even” data the Pf genome was very biased. They made PGM libraries using physical shearing and “Fragmentase” digestion using the Ion Xpress kits and showed both to be comparable. These were run on 316 chips for 65 cycles, generating mean read lengths of 120 base pairs. Standard PacBio libraries were prepared and sequenced using C1 chemistry on multiple SMRT-cells how many?

What did they find: PGM struggled with the very AT rich Pf genome, and the bias appeared to be partly in the library-prep. By tweaking the protocol and swapping the polymerase for a better one they demonstrated a significant improvement in results. Why don’t all companies do this kind of testing before releasing products on us users, using the best polymerase or ligase available can make a huge difference.

Error rates were best for MiSeq, no surprise to Illumina users there. But there was no impact on true-SNP calling with PGM doing best at 15x genome coverage although it did produce more incorrect SNP calls. PGM and MiSeq correctly called 82% and 76% of SNPs and produced 1800 and 1300 incorrect SNP calls respectively. For Illumina MiSeq made more correct SNP calls than HiSeq or GAIIx and Nextera library prep worked as well as the standard protocol. Both MiSeq and PGM’s built-in variant calling was inadequate; MiSeq reporter called 7% and Torrent suite called 1.5% of variants. SNP calling for PacBio was hampered by a lack of tools as most are designed for short-read data.

A word of caution: The paper is out-dated as are all comparisons and the authors are happy to acknowledge this. It takes time to perform an experiment like this, analyse it and finally write it up. C2 chemistry was used for PacBio and a new method has been described for magnetic loading of chips. MiSeq now has 500bp kits available and even more reads. PGM has error rate has improved. MiSeq has an upgrade being rolled out now for more and longer reads. To be fair to the non-Illumina platforms MiSeq is based on a pretty mature technology whilst Ion and PacBio should be given some time to catch-up (and perhaps overtake), some of the issues with the PGM and PacBio might be resolved by evolution.

GenomeWeb had comments from Ion, Illumina and PacBio. Ion and Illumina both said the comparison was fair. Ion clarified this by saying that the data showed what was possible in 2011 but that error rate was now just 0.4%. Whilst IlluminaLoman et al presented.

Mike also spoke to GenomeWeb and said that the same test genomes are still being run and that the results were as valid today as back in 2011. Significant improvements had come from PGM 200 cycle kits and the C2 chemistry for PacBio.

I am confident there will be more of these comparisons in the next few months. Expect at least one AGBT presentation and lots more discussion over beers.

See you at the bar perhaps?

What do celebrities think about science and what do scientists think of celebrity genomes?

Sense About Science is an organisation that tries to provide expert advice on scientific matters to whoever needs it. They monitor the papers and news and produces an annual “Celebrities and Science” round up of the best and worst comments from people in the public eye. The organisation behind Sense About Science has come under some criticism for being pro-GM and a bit radical and certainly not everyone is a fan. But I enjoyed reading through their annual reviews and wanted to share a few of my favourite comments. The best for me was from Nicole ‘Snooki’ Polizzi who said “the oceans were salty because of all the whale sperm”! See the bottom of this post for a selection from the last three years round-ups.

Sense About Science scan many publications looking for comment; of course celebs and politicians don’t always get it wrong but it is far easier to pick up on the crazies out there. There appear to be fewer celebrities who deny evolution or suggest “fossil fuels” aren’t running out, whilst some politicians careers appear to be built on such claims.

If you want to help out then you can sign up or email them with examples of bad science. 

What do Scientists think of celebrity genomes? Jeff Barrett's web page at the Sanger has coverage of a debate on the value of celebrity genomes between Ewan Birney and Paul Flicek. This was part of a series of events at the Sanger institute looking at the relationship between society and personal genomics.

Jeff chaired the debate and before starting the room was evenly split between those who agreed, disagreed or were undecided on the statement “celebrity genomes are a useful contribution to science and society”.

The debate focused around how useful genomes from celebrities were in creating a dialogue between scientists and the public. Paul argued that celebrity genomes are no more important than non-celebrity genomes, so what makes celebrities qualified to speak about genomics? Ewan argued that celebrity genomes have contributed to science, even if only a little. At the end of the debate Jeff asked the audience to judge what impact they thought celebrity genomes had on science, 33% said positive, 62% said negative and 4% were undecided. He also asked the audience if they thought celebrity genomes had had an impact on society, 41% positive, 51% negative and 8% were undecided.

During the debate Paul talked about the impact celebrities can have as patient advocates using Michael J Fox and Parkinsons as an example. Celebrities have as much chance of developing cancer as any of us and as they get their cancer genomes sequenced and see a benefit from the “treatment” they are uniquely placed to talk about the impact in a way that is going to get across to more people than coverage of a Nature paper on the BBC six o’clock news will ever do.

We should be trying to engage with this as much as possible, shouldn’t we?

PS: If you are a celebrity (why wouldn’t they be reading my blog?) and need some advice then help is just a phone call away, call sense about science on +44(0)20 7478 4380. I can’t promise they can say how many reads you’ll need for your next exome sequencing experiment!

PPS: If you want your celebrity genome sequenced there are plenty of labs in LA.


My pick of the best and worst from the annual round-ups.
Positive:

Bonnie Tyler when questioned about trying acupuncture said “I lost some weight but I was also on a more sensible diet at the same time which, if I’m cynical, is more likely the reason for the weight loss.” And Natascha McElhone’s comments about tetanus after a visit to Angola: “It’s completely preventable if you’re inoculated against it.”

Negative:

Heather Mills “meat sits in your colon for 40 years and putrefies, and eventually gives you the illness you die of. And that is a fact.”

Roger Moore “eating foie gras can lead to Alzheimer’s, diabetes and rheumatoid arthritis. In short, eating foie gras is a tasty way of getting terminally ill.” I don’t eat foie gras on compassionate grounds but it is unlikely to be the cause of so many diseases, and I am not sure any of those Sir Patrick listed are actually terminal?

Alex Reid gave out a horrible message about unprotected sex saying “it’s actually very good for a man to have unprotected sex as long as he doesn’t ejaculate” and “semen has a lot of nutrition. A tablespoon of semen has your equivalent of steak eggs, lemons and oranges.” Irresponsible nutter if you ask me!

Julia Sawalha doesn’t get inoculated or take anti-malarials but uses “ homeopathic alternatives, called ‘nosodes’” and said “I’m the only one who never goes down with anything.”

Joanna Lumley, her AbFab co-star put the increase in cancer down to “the growth hormones in the food we eat, that try to make all the chickens, sheep and cows, more productive”.

Sarah Palin who’s autobiography “Going Rogue” says that she “didn’t believe in the theory that human beings — thinking, loving beings — originated from fish that sprouted legs and crawled out of the sea or from monkeys who eventually swung down from the trees.” Yikes how can such strong anti-evolution views be held by someone who (from a UK news coverage perspective) holds some power in the USA?

Michelle Bachman, member of the US House of Representatives and Republican Presidential Candidate, told journalists that a woman had told him her daughter suffered mental retardation after receiving the HPV vaccine, and that this vaccination program has dangerous consequences. What is the likelihood she is a right-wing, pro-christian, pro-guns, anti-abortion Republican?

These last two particularly disturb me. The first highlights how nuts some politicians are. The second because as the UK MMR scare showed, bad science can become mainstream fact and affect us all in a very negative way.

We shouldn’t believe everything we hear in the press, but politicians surely have an obligation to be careful about what they say.

Wednesday, 8 August 2012

What happened to Illumina’s single molecule sequencing or do you remember Solexa’s SMA-seq?

Eight years is a long time in NGS. I recently re-read a 2004 article in Pharmacogenomics 2004, and also found a EBI presentation from Clive Brown and Ewan Birney. Both of these were from a small company based in Cambridgeshire called Solexa. At the time of publication they had only just identified their first alpha-test site and the presentation talked about a prototype instrument ready for the end of 2004. 

Prototpye GA1
Trademarks mentioned in the paper such as SMA-seq and TotalGenotyping have not, I suspect, been heard of by most Illumina sequencing users (including myself). 

The paper describes where Solexa came from (Shankar Balasubramanian and David Klenerman's patents of 1998 spun out of Cambridge University Department of Chemistry). It mentions Solexa's demonstration version of “a system that will allow rapid, base-by-base comparison of genomic DNA sequences” and that this will produce “four or five orders of magnitude improvement over conventional sequencing”. Read lengths of just 25-30bp are proposed, and a nice graph illustrates how just over 80% of the Human genome is uniquely mappable with these incredibly  short reads.

Simon Bennett, business development director of Solexa at the time and author of the Pharmacogenomics paper suggests that Solexa will achieve the $1000 genome within the next ten years. That leaves us two more years to get to $1000 genomes. It does not seem unreasonable that we’ll get there although more discussion today is about the cost of bioinformatics analysis!

What happened to single molecule sequencing: There is an overview of the Solexa Single Molecule ArrayTM technology that the paper suggest can analyse a Human genome in a single experiment. As described there were just 100,000 DNA molecules per cm2 compared to 100M cm2 today. The basic chemistry description is unchanged from current SBS, although only 25 bases were being sequenced at the time of publication.

It is only towards the end of the paper that Solexa’s acquisition of Manteia’s solid surface bridge-amplification technology, this is the clustering we know and love today. Up until this point Illumina had been focusing on single molecule sequencing. Without the acquisition of Manteia perhaps Solexa would have continued to chase single molecule sequencing and ended up like Helicos or Pacific BioSciences. As it stands clustering and SBS chemistry have been the bedrock of next-gen sequencing for the past five years.

Personally I’d bet Illumina are still putting lots of effort into single molecule approaches, and not just by investing in companies like ONT. I’d like to know if it would be possible to sequence single molecules on a HiSeq with a more sensitive camera (massive oversimplification I know)? Imagine 1000M single molecule reads! This might not be what we ultimately use for single-molecule but I think we can be certain there is a lot more coming for next-gen in the next eight years.

PS: Would SOLiD have been the dominant technology if Agencourt had bought Manteia instead? Perhaps we should have a genomics version of Marvel’s “What if” comic books from the 80’s?

PPS: The Illumina history lesson also taught me that we share half our genes with bananas!


Friday, 3 August 2012

Is visual QC of NGS libraries needed anymore?

I have been using the Bioanalyser since its introduction in 1999. Originally intended for QC analysis of total RNA for microarray studies it quickly became a standard tool for many labs. Over the past few years we have run almost as many NGS libraries on DNA 1000 assays as we have RNA chips.

I think we are going to stop using it for all but a small proportion of libraries by next year.

The Bioanalyser has been a great tool for quality control of NGS libraries. Users can clearly see if they have prepared a high-quality library, if there is lots of adapter-dimer present and if the insert size is what they expected. Unforunately running the Bioanalyser is a bit of a pain once you have more than 12 or 24 libraries.

In my lab we are now preparing 24, 48 and 96 libraries in each batch. QC of these has become too much work using current methods so we looked at alternatives. This included the Caliper LabChip GX, Shimazdu MultiNA, Agilent ScreenTape, Qiagen QIAxcel and Advanced Analytical’s Fragment Analyser (see the bottom of this post for a full list of features).


From our analysis of the system features we asked for demonstrations of the Caliper and Advanced Analytical instruments. These two both appeared to give us the throughput and sensitivity we need, both systems worked well and I know of several labs using these instruments very successfully. However we decided not to invest in a high-throughput Bioanalyser.

Why not and what do we want from library QC: most users want sequence results as soon as possible and are happy with some libraries failing so for some the QC is seen as a bar that gets in the way of their science. My lab wants to satisfy all users and return the highest percentage possible of high quality sequencing runs. Generating 40M reads of a poor library is no use to anyone.

With the introduction of 96 and 384 index kits from companies like Bioo Scientific and with Illumina finally catching up with the TruSeq HT kits I think we are ready to ditch gel-based analysis. Instead we will start using a QC pipeline that will use the data from a single lane analysis of up to 96 libraries. We can look at computed insert-size, verify quantification by checking pooling ratios, screen for adapter-dimer or contamination with other genomes and make sure duplication rates are not too high. Even with 96 samples we should get around 1-2M reads each, and some readers of this blog may remember when 1 M reads was considered enough for ChIP-seq analysis, let alone QC! There are also some hints that 1M reads might be acceptable for basic differential gene expression analysis of highly expressed transcripts.

We’ll be slowly retiring the Bioanalyser type analysis of libraries and using the qPCR quantification as a simple QC tool for pass/fail decisions. We might even get to a point that we only quantify the final pool after mixing equal volumes of all 96 libraries, such that cluster density is spot-on. Then we can use the sequence demultiplexing to indicate the actual balance of indexes to re-pool for the final high read number sequencing.

High Throughput Bioanalyser Platform Features
Caliper - Labchip GX
  • High throughput bioanalyser with 96 and 384 well compatibility
  • Asseses RNA quality and gives exact sizing and quantification of DNA fragments.
  • Can analyse 96 samples in less than 1 hour
  • RNA metrics are used to calculate the RGS value (RNA quality score) which has been validated to correlate with the agilent bioanalyser RIN score. This would be beneficial since users are already familiar with a RIN value for assessing RNA quality.
  • Resolution down to 5bp and sensitivity of 0.1 ng/ul
  • Can visualise the results on electropherogram or gel view similar to Agilent 2100.
  • Data can be viewed in tabular form which can be easily exported/uploaded onto our LIMS system.
  • High sensitivity kit also available
  • There is a barcode reader for sample tracking which would be important when running large numbers of samples.
Shimadzu Biotech – MCE 202 MultiNa
  • This is a microchip electrophoresis system for DNA/RNA analysis.
  • Reusable microchips are used which could reduce running and consumable costs.
  • 120 samples can be run simultaneously across 4 separate microchips with 80 seconds per sample processing speed.
  • It can also perform automatic or manual reanalysis of the samples as seen with the agilent bioanalyser and can export the results in a csv. format.
lab901 Agilent - Screentape
  • The Lab901 ScreenTape system is a fully automated system for gel electrophoresis. The ScreenTape instrument loads, separates, images and analyses both DNA and RNA samples. It does this by loading each sample onto a screentape each of which contain 16 microgels which align to built in electrodes and imaging system.
  • Only 1 ul of sample is required and analysis takes 1 minute per sample. It is fully automated with prepacked reagents so there is no gel preparation or chip priming.
  • Different screentapes are available for DNA and RNA analysis.
  • For RNA analysis, quality is displayed as the screentape degradation value (SDV)
Qiagen- QIAxcel system
  • A microcapillary electrophoresis system, which is fully automated and can process up to 96 samples per run. Separation is performed in a capillary of precast gel cartridge which are reusable.
  • Sensitivity of 0.1ng/ul Resolution down to 3-5 bp.
  • Sample consumption is less than 0.1ul, although the minimum sample volume to load for analysis is 10ul.
  • 96 samples can be processed in approximately 1 hour.
  • The data can be viewed as electropherogram or gel images.
Advanced Analytical –Fragment Analyser
  • is a fluorescence-based capillary electrophoresis instrument for both sizing and quantifying nucleic acids (DNA and RNA).
  • Can run either 12 samples or 96 samples at a time
  • The instrument provides space for up to six 96-well plates
  • Can be used to quantify and qualify NGS fragments, RNA, genomic DNA and also for mutation detection, Microsatellite (SSR) analysis.
  • Various capillary lengths can be used, depending on the application, required resolution and desired speed of analysis. Longer arrays provide resolution down to 2 bp for fragments under 300 bp in length. Shorter arrays still provide good resolution with run times as fast as 15 minutes
  • PROSize™ software is used to analyse the data and this can be viewed as a gel view, electropherogram or a results table.
  • The data is exportable and can be linked to the LIMS.


Tuesday, 31 July 2012

Sequencing acronyms updated

A year ago I wrote a post about the explosion of different NGS acronyms. When I wrote it I was surprised to see over 30 different acronyms and suggested that part of this was authors wanting to make their work stand out, hopefully coining the next “ChIP-seq”.

In the past year more and more NGS acronyms have been published. I am partly responsible for one of these TAm-seq and understand better the reasoning for using acronyms. Once I have spoken to someone about the work we did in the STM paper I can simply refer to TAm-seq in future conversations.

It might help if we as a community could agree on a naming convention to make searching for work using specific techniques easier. There are multiple techniques for analysis of RNAs and using the catch-all “RNA-seq” would allow much quicker PubMed searching. Of course we would need to add keywords around the particular technique being used, RNA-seq could encompass mRNA, ribosome removal, strand-specific, small, micro, pi, linc, etc, etc, etc.

Here is a list of acronyms that we in the community could use to simplify things today. It would obviously need tidying up every year or so as new acronyms get added.
  • DNA-seq: Unmodified genome sequencing.
  • RNA-seq: All things RNA.
  • SV-seq: Structural-variation sequencing.
  • Capture-seq: Exomes and other target capture sequencing.
  • Amplicon-seq: Amplicon sequencing.
  • Methyl-seq: Methylation and other base modification sequencing.
  • IP-seq: Immuno-Precipitation sequencing. 
Let me know what you think

Again, here is a link to the data.

Monday, 23 July 2012

Visualisation masterclass

One of my favourite columns in any scientific journal is Nature Methods “Points of View” by Bang Wong. The column is focused on visualisation and presentation of scientific data and I’d highly recommend it if you haven’t already seen it.

Here is a link to Nature Methods and also a public Mendeley group (please feel free to join) so you can access the papers, Bang Wong's points of view. I'd be very interested in a hard-copy version, perhaps the articles expanded and collected into a book?

Data visualisation is improving all the time: In the March 2010 issue of Nature Methods the Creative Director of the Broad Institute, Bang Wong, was senior author on a paper highlighting some of the challenges we face in visualising complex data sets. The paper presents some of the developments over the past twenty years that today allow almost anyone to; create a phylogenetic tree, a complex pathway diagram or a transcriptome heat map. We are generating huge amounts of data and visual tools for interpretation are vital. Fortunately there are lots of people working on this.

Circos plots: I am always struck by how much data is conveyed in a circus plot, and these are becoming more complex as data sets grow. Can you imagine how many slides you would have needed to use just three or four years ago? The Circos tool was published in Genome Research in 2009. There is a Circos website and the New York Times had a great feature way back in 2007 highlighting what was possible with this new visualisation tool.


Points of view: The column covers many aspects of data visualisation and presentation. Some highlights for me are:

Colour: Spiralling through the colour wheel when choosing colours to use in figures can allow the same visual impact in both colour and black-and-white print. Adobe Illustrator and Photoshop allow you to simulate what Red:Green colour-blindness will do to your figures, and replacing red with magenta makes images accessible for all. Colour can be misleading and sometimes a simple black line will do.

Whitespace: Absence of colour is important. Many scientific presentations and posters covey too much information and don’t have enough empty page to allow readers to see how the text should flow.

Typeface: The reason we use serif typeface in text is because the ‘feet’ help us follow the line of the text. A generalisation is that serif fonts should be used for large blocks of text (posters and papers) and sans serif fonts for smaller strings of text (presentation slides). Spacing of words and paragraphs can have a dramatic impact on the readability of a document.


Simplification: If your data is easy to read then people will read it. Sounds simple, but I am sure many of us have prepared posters with far too much information, that need lots of explanation, yet we get less than one minute with people in the poster session. Identifying your most important idea and focusing on that can help.

I’d also recommend Bang’s website http://bang.clearscience.info which has links to lots of interesting visualisation and scientific art as well. Enjoy.


PS: If the posts on my blog are not taking all this into account, or if you see a poster or presentation of mine that could be improved then let me know. Remember that feedback has to be constructve!

Thursday, 19 July 2012

DNA multiplexing for NGS by weighted pooling has some practical limitations

The number of samples being run in sequencing projects seems is rapidly increasing. As groups move to running replicates (why on earth we didn't do this from day one is a little mind boggling). Most experiments today are using some form of multiplexing, commonly by sequencing single or dual-index barcodes as separate reads. However there are other ways to crack this particular nut.

DNA Sudoku was a paper I thought very interesting and uses a combinatorial pooling that upon deconvolution identifies the individual a specific variant comes from. We used similar strategies for cDNA library screening using 3-dimensioal pooling of cDNA clones in 384 well plates.

One of the challenges of next-gen is getting the barcodes onto the samples as early in the process as possible to reduce the number of libraries that ultimately get sequenced. If barcodes are added at ligation then every samples needs to be handled independently from DNA extraction, through QC, fragmentation and end repair. Ideally we would get barcodes on immediately after DNA extraction but how?

A paper in Bioinformatics addresses this problem very neatly, but in my view oversimplifies the technical challenges users might face in adopting their strategy. In this post I'll outline their approach and address the biggest challenge in pooling (pipetting) and highlight a very nice instrument from Labcyte that could help if you have deep pockets!

Varying the amount of DNA from each individual in your pool: In Weighted pooling—practical and cost-effective techniques for pooled high-throughput sequencing David Golan, Yaniv Erlich and Saharon Rosset describe the problems that multiplexing can address, namely the ease and costs of NGS. They present a method that relies on pooling DNA from individuals at different starting concentrations and using the number of reads in the final NGS data to deconvolute the samples without resorting to adding barcodes. They argue that their weighted design strategy could be used as a cornerstone of whole-exome sequencing projects. That's a pretty weighty statement!

The paper addresses some of the problems faced by pooling, in it they not e that the current modelling of NGS reads is not perfect, that a Poisson distribution is used where reads in actual NGS data sets are usually more dispersed but that this can be overcome by sequencing more deeply and that is pretty cheap to do.

There is a whole section in the paper (6.2) on "cost reduction due to pooling". The two major costs they consider are genome-capture ($3000/samples) and sequencing (PE100 $2,200/lane). Pooling reduces the number of captures required but increases sequencing depth per post-capture library. They use a simple example where 1Mb is targeted in 1000 individuals.

In a normal project the 1000 library prep and captures would be performed and 333 post-capture libraries sequenced in each lane to get 30x coverage. The cost is $306,600 (1000×$300+3×$2200).

In a weighted pooling design with 185 pools of DNAs (at different starting concentrations) now only 185 library prep and captures would be performed but only 10 post-capture libraries are sequenced in each lane to get the same 30x coverage of each sample. The cost of the project drops to $96,200 (185×$300+18.5×$2200).

There is a trade-off as you can lose the ability call variants of MAF >4% but this should be OK if you are looking for rare variants in the first place.
 
Multiplexing can go wrong in the lab: We have seen multiplexed pools that are very unbalanced. Rather than nice 1:1 equimolar pooling the samples have been mixed poorly and are skewed. The best might give 25M reads and the worst 2.5M reads, and if you need 10M reads per sample then this will result in a lot of wasted sequencing.

Golan et al's paper does not explicitly model pipetting error. This is a big hole in the paper from my perspective but one that should be easily filled. The major issues are pipetting error during quantification leading to poor estimation of pM concentration AND pipetting error during normalisation and/or pooling. This is where the Bioinformaticians need some help from us wet-lab folks as we have some idea as to how good or bad these processes are.

There are also some very nice robots that can simplify this process. One instrument in particular stands out for me and that is the Echo liquid handling platform, which uses acoustic energy to transfer 2.5nl droplets from source to destination plates. There are no tips, pin, or nozzles and zero contact with the samples. Even complex pools from un-normalised plates of 96 libraries could be quickly and robustly mixed in complex weighted designs. Unfortunately the instrument costs as much as a MiSeq, so expect to see one at Broad, Sanger, Wash U or BGI but not labs like mine.

Wednesday, 18 July 2012

Illumina's Nextera capture: is this the killer app?

Illumina have released new Nextera Exome and Nextera Custom enrichment kits. These combine the rapid and simple sample prep of Nextera to in-solution genome capture and provide a straight-forward two-and-a-half day protocol. Add one day of sequencing on 2500 and you can expect your results in under one week.

I think many people did not expect exome costs to drop so fast. Ilumina's reduction of 80% was welcomed by many groups who wanted to run high numbers of exomes but could not when faced with the high costs and complex workflow without pre-capture pooling that other products had. Processing exomes is getting much easier on all fronts. Nimblegen compare their EZ-cap3 to Agilent in the EZ-cap v3 flyer, they did not include Illumina in thecomparison but they did use Illumina sequencing. It looks like Illumina can't lose whatever exome kit you buy!

A sequenced Nextera exome will cost £250 or $400 with 48 sample kits costing about £4000 and a PE75bp lane about £1000. That's cheaper than some companies are selling their exome or amplicon oligos for!

Nextera capture, how does it work: My lab beta-tested the new kits for exome and custom capture. The workflow was as simple as we expected and the data were high-quality. Nextera sample prep still uses just 50ng DNA and takes about three hours. The exome is the same 62MB but now with 12-plex pre-enrichment sample pooling, and still has two overnight captures.

We are still completing processing on our HiSeq of the full data set, but the initial analysis showed similar on and off-target results when compared to TruSeq, there was a higher duplication rate than we would normally see.

Below are three slides I put together for a recent presentation where I discussed our experiences with Nextera capture. They show that Nextera prep is simple (slide1), that QC can be confusing (slide2) but that results are good and costs are low (slide3). As low as £0.01 per exon!


Does Nextera custom capture kill amplicon-sequencing: You can design custom capture kits using Illumina's DesignStudio (reviewed here). The process is pretty straight-forward and a pool of oligos is soon on its way to you.

Illumina's Nextera capture only requires 50ng of DNA while TruSeq custom amplicon needs 250ng, so Nextera lets you capture more with less DNA. Small Nextera captures run at very high multiplexing on HiSeq 2500 are likely to be far cheaper than low-plexity amplicon screens on MiSeq. If Nextera custom capture can move to 96-plex pre-capture pooling then the workflow gets even easier (see the bottom of this thread for some numbers supporting this idea).

It will be interesting to see how the community repsinds to Nextera capture. If it takes off then Agilent, Nimblegen, Multiplicom, Fluidigm and others are going to be squeezed. There was a recent paper (MSA-cap seq) from the Institute of Cancer Research describing a low-input 50ng prep for Agilent capture, others like Rubicon and Fluidigm are aiming for the low input space, even single cells.

I am sure we have a lot more to look forward to for the second half of 2012.
Although I still don't see a $1 sample prep!


PS: One comment I have sent back to the development team is that the protocol requires the same 500ng library input into capture for exome and custom capture. This means the ratio of target to probe is much higher for custom capture and might be reduced. This would allow users to run custom capture with much less PCR. Alternatively if users stick with a 500ng input to capture then they might be able to increase pooling to much higher levels.

Exome capture uses 350,000 probes for 62Mb and 500ng capture input, giving 1.4ng per 1000 probes.
Custom capture uses 6,000 probes per 1Mb and 500ng capture input, giving 83ng per 1000 probes.
Can we run 96-plex pre-capture pooling?

Another thing I would like to see is the impact of completing only one round of capture. I'd assume we'd see a higher number of off-target reads. However saving a day when sequencing is so cheap for a small custom screening panel could be well worth it.

Wednesday, 11 July 2012

How NGS helped a physician scientist beat his own leukaemia

An amazing story was featured in the New York Times, the article follows Dr. Lukas Wartman from Wash U who is a leukaemia researcher who developed leukaemia himself.

The Genome Institute at Wash U made a concerted effort to find out what was behind Dr Wartman’s disease, performing tumour:normal and tumour RNA-seq analysis. He was fortunate to be included in a research study that was ongoing at Wash U, although that creates all sorts of ethical issues around who can access treatment and who cannot.

From the sequence analysis they found that FLT3 was more highly expressed than usual and could be driving his leukaemia. The drug Sutent had recently been approved for treating advanced kidney cancer, and it does it by inhibiting FLT3. Howwever it had never been used for leukaemia and unfortunately is costs $330 a day. Dr Wartman’s insurers and Pfizer turned him down for treatment.

The doctors he works with chipped in to buy a months supply and the treatment worked. Microscopic analysis showed the blood was clean, flow cytometry found no cancer cells and FISH was clear as well. Dr Wartman is back in remission and I certainly wish him all the best.

I'd love to hear back if circulating-tumor DNA analysis of his plasma is used as a monitoring test.

Tuesday, 3 July 2012

Is genomic analysis of single cells about to get a whole lot easier?

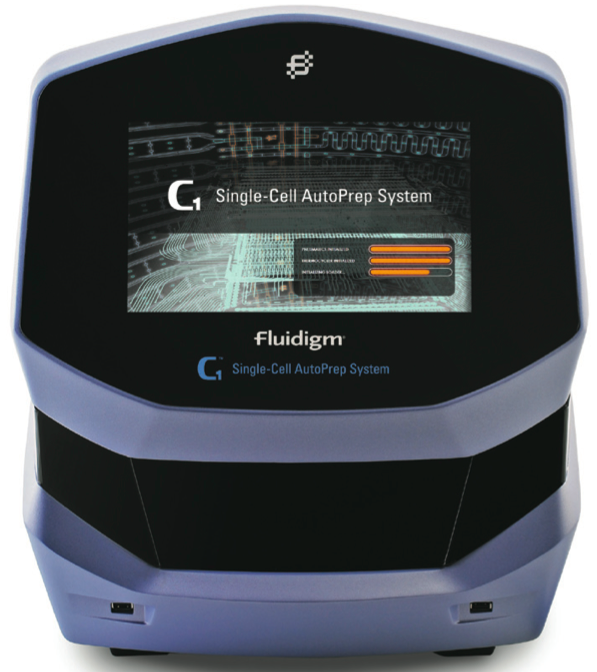
A couple of months ago Fluidigm disclosed the latest addition to their microfluidic chip technology, the C1 single-cell analysis system.

At the disclosure in May the details of the C1 were a little sketchy but the system was planned to take cell suspensions, separate and capture single-cells for nucleic-acid analysis on the Biomark system. The disclosure also hinted at the ability to process single-cells for NGS applications such as transcriptome and copy-number analysis. One rather worrying detail was the fact that the C1 was lumped together with the Biomark and FACS instruments as far as likely cost is concerned.

This means it is probably going to be an expensive instrument, which could limit its uptake. Like many sample prep systems only a few labs will have the capacity to run the box at full tilt. This often makes the investment hard to justify and labs end up sharing systems or using a service.
 

How does the system work: The C1 will take cells in suspension and isolate 96 single-cells. On the system you will be able to stain and image captured cells to determine what sort of cells are present from your population. Cells are then lysed and you can perform molecular biology on the nucleic acids (mRNA RT and pre-amp for now). Finally nucleic acids are recovered from the inlet wells for further analysis.


What is most interesting from my perspective is the ability to tie the C1 to NGS sample prep, either through transcriptome and/or Nextera based library prep, targeted resequencing through Access Array (see our recent paper for ideas) or WGA. If we can prepare libraries with 96 barcodes then I can see some wonderful experiments coming out of work in Flow Cytometry and Genomics labs.

What do I want to do with it: There are so many unanswered questions in biology that are hampered by using data from heterogeneous pools of cells; e.g. Tumours. Being able to dissociate cells, sort by flow cytometry and analyse with NGS is going to be powerful. From my experience of flow cytometry it is nearly always the case that any population of cells can be further subdivided. Being able to perform copy-number, mutation profiling or differential gene expression analysis on these populations is going to help get a better understanding of how much subdivision is required. Being able to capture perhaps 200 circulating tumour cells from a patient and sequence each of these is going to help us understand cancer evolution and metastasis. There are so many possibilities.

The C1 may also help one complex type of experiment that is often not replicated highly enough, low cell number gene expression. Some of my users provide flow sorted cells from populations that vary in number. Being able to run a pool of perhaps 100 cells from each population in a single C1 chip and get high quality GX data is going to remove much of the technical bias and enable more powerful statistical analysis.

Unfortunately this is going to mean lots of sequencing. Even if we can get away with 2M reads per sample for differential gene expression (genes, not exons or isoforms), then we’ll need to run a lane per C1 chip. It is not clear if we be able to generate copy-number analysis of sufficient quality from 0.25x coverage of a genome, although I have some ideas about that I'll post about later.

However for groups working on model organisms where cells can be grown in suspension or dissociated before analysis the C1 could be a phenomenal advance. Imagine individual C.elegans dissociated, cells identified by labelling, tagged by transcriptome library prep and sequenced. Fate-mapping on steroids anyone!

My lab has been working with Fludigm for two and a half years on the Biomark and Access Arrays and we did hear early on about their single-cell projects. I am excited to see a product is now available and look forward to working with the technology. Now all I have to do is find out just how much it will cost to complete an experiment!