Tuesday, 31 July 2012

Sequencing acronyms updated

A year ago I wrote a post about the explosion of different NGS acronyms. When I wrote it I was surprised to see over 30 different acronyms and suggested that part of this was authors wanting to make their work stand out, hopefully coining the next “ChIP-seq”.

In the past year more and more NGS acronyms have been published. I am partly responsible for one of these TAm-seq and understand better the reasoning for using acronyms. Once I have spoken to someone about the work we did in the STM paper I can simply refer to TAm-seq in future conversations.

It might help if we as a community could agree on a naming convention to make searching for work using specific techniques easier. There are multiple techniques for analysis of RNAs and using the catch-all “RNA-seq” would allow much quicker PubMed searching. Of course we would need to add keywords around the particular technique being used, RNA-seq could encompass mRNA, ribosome removal, strand-specific, small, micro, pi, linc, etc, etc, etc.

Here is a list of acronyms that we in the community could use to simplify things today. It would obviously need tidying up every year or so as new acronyms get added.
  • DNA-seq: Unmodified genome sequencing.
  • RNA-seq: All things RNA.
  • SV-seq: Structural-variation sequencing.
  • Capture-seq: Exomes and other target capture sequencing.
  • Amplicon-seq: Amplicon sequencing.
  • Methyl-seq: Methylation and other base modification sequencing.
  • IP-seq: Immuno-Precipitation sequencing. 
Let me know what you think

Again, here is a link to the data.

Monday, 23 July 2012

Visualisation masterclass

One of my favourite columns in any scientific journal is Nature Methods “Points of View” by Bang Wong. The column is focused on visualisation and presentation of scientific data and I’d highly recommend it if you haven’t already seen it.

Here is a link to Nature Methods and also a public Mendeley group (please feel free to join) so you can access the papers, Bang Wong's points of view. I'd be very interested in a hard-copy version, perhaps the articles expanded and collected into a book?

Data visualisation is improving all the time: In the March 2010 issue of Nature Methods the Creative Director of the Broad Institute, Bang Wong, was senior author on a paper highlighting some of the challenges we face in visualising complex data sets. The paper presents some of the developments over the past twenty years that today allow almost anyone to; create a phylogenetic tree, a complex pathway diagram or a transcriptome heat map. We are generating huge amounts of data and visual tools for interpretation are vital. Fortunately there are lots of people working on this.

Circos plots: I am always struck by how much data is conveyed in a circus plot, and these are becoming more complex as data sets grow. Can you imagine how many slides you would have needed to use just three or four years ago? The Circos tool was published in Genome Research in 2009. There is a Circos website and the New York Times had a great feature way back in 2007 highlighting what was possible with this new visualisation tool.


Points of view: The column covers many aspects of data visualisation and presentation. Some highlights for me are:

Colour: Spiralling through the colour wheel when choosing colours to use in figures can allow the same visual impact in both colour and black-and-white print. Adobe Illustrator and Photoshop allow you to simulate what Red:Green colour-blindness will do to your figures, and replacing red with magenta makes images accessible for all. Colour can be misleading and sometimes a simple black line will do.

Whitespace: Absence of colour is important. Many scientific presentations and posters covey too much information and don’t have enough empty page to allow readers to see how the text should flow.

Typeface: The reason we use serif typeface in text is because the ‘feet’ help us follow the line of the text. A generalisation is that serif fonts should be used for large blocks of text (posters and papers) and sans serif fonts for smaller strings of text (presentation slides). Spacing of words and paragraphs can have a dramatic impact on the readability of a document.


Simplification: If your data is easy to read then people will read it. Sounds simple, but I am sure many of us have prepared posters with far too much information, that need lots of explanation, yet we get less than one minute with people in the poster session. Identifying your most important idea and focusing on that can help.

I’d also recommend Bang’s website http://bang.clearscience.info which has links to lots of interesting visualisation and scientific art as well. Enjoy.


PS: If the posts on my blog are not taking all this into account, or if you see a poster or presentation of mine that could be improved then let me know. Remember that feedback has to be constructve!

Thursday, 19 July 2012

DNA multiplexing for NGS by weighted pooling has some practical limitations

The number of samples being run in sequencing projects seems is rapidly increasing. As groups move to running replicates (why on earth we didn't do this from day one is a little mind boggling). Most experiments today are using some form of multiplexing, commonly by sequencing single or dual-index barcodes as separate reads. However there are other ways to crack this particular nut.

DNA Sudoku was a paper I thought very interesting and uses a combinatorial pooling that upon deconvolution identifies the individual a specific variant comes from. We used similar strategies for cDNA library screening using 3-dimensioal pooling of cDNA clones in 384 well plates.

One of the challenges of next-gen is getting the barcodes onto the samples as early in the process as possible to reduce the number of libraries that ultimately get sequenced. If barcodes are added at ligation then every samples needs to be handled independently from DNA extraction, through QC, fragmentation and end repair. Ideally we would get barcodes on immediately after DNA extraction but how?

A paper in Bioinformatics addresses this problem very neatly, but in my view oversimplifies the technical challenges users might face in adopting their strategy. In this post I'll outline their approach and address the biggest challenge in pooling (pipetting) and highlight a very nice instrument from Labcyte that could help if you have deep pockets!

Varying the amount of DNA from each individual in your pool: In Weighted pooling—practical and cost-effective techniques for pooled high-throughput sequencing David Golan, Yaniv Erlich and Saharon Rosset describe the problems that multiplexing can address, namely the ease and costs of NGS. They present a method that relies on pooling DNA from individuals at different starting concentrations and using the number of reads in the final NGS data to deconvolute the samples without resorting to adding barcodes. They argue that their weighted design strategy could be used as a cornerstone of whole-exome sequencing projects. That's a pretty weighty statement!

The paper addresses some of the problems faced by pooling, in it they not e that the current modelling of NGS reads is not perfect, that a Poisson distribution is used where reads in actual NGS data sets are usually more dispersed but that this can be overcome by sequencing more deeply and that is pretty cheap to do.

There is a whole section in the paper (6.2) on "cost reduction due to pooling". The two major costs they consider are genome-capture ($3000/samples) and sequencing (PE100 $2,200/lane). Pooling reduces the number of captures required but increases sequencing depth per post-capture library. They use a simple example where 1Mb is targeted in 1000 individuals.

In a normal project the 1000 library prep and captures would be performed and 333 post-capture libraries sequenced in each lane to get 30x coverage. The cost is $306,600 (1000×$300+3×$2200).

In a weighted pooling design with 185 pools of DNAs (at different starting concentrations) now only 185 library prep and captures would be performed but only 10 post-capture libraries are sequenced in each lane to get the same 30x coverage of each sample. The cost of the project drops to $96,200 (185×$300+18.5×$2200).

There is a trade-off as you can lose the ability call variants of MAF >4% but this should be OK if you are looking for rare variants in the first place.
 
Multiplexing can go wrong in the lab: We have seen multiplexed pools that are very unbalanced. Rather than nice 1:1 equimolar pooling the samples have been mixed poorly and are skewed. The best might give 25M reads and the worst 2.5M reads, and if you need 10M reads per sample then this will result in a lot of wasted sequencing.

Golan et al's paper does not explicitly model pipetting error. This is a big hole in the paper from my perspective but one that should be easily filled. The major issues are pipetting error during quantification leading to poor estimation of pM concentration AND pipetting error during normalisation and/or pooling. This is where the Bioinformaticians need some help from us wet-lab folks as we have some idea as to how good or bad these processes are.

There are also some very nice robots that can simplify this process. One instrument in particular stands out for me and that is the Echo liquid handling platform, which uses acoustic energy to transfer 2.5nl droplets from source to destination plates. There are no tips, pin, or nozzles and zero contact with the samples. Even complex pools from un-normalised plates of 96 libraries could be quickly and robustly mixed in complex weighted designs. Unfortunately the instrument costs as much as a MiSeq, so expect to see one at Broad, Sanger, Wash U or BGI but not labs like mine.

Wednesday, 18 July 2012

Illumina's Nextera capture: is this the killer app?

Illumina have released new Nextera Exome and Nextera Custom enrichment kits. These combine the rapid and simple sample prep of Nextera to in-solution genome capture and provide a straight-forward two-and-a-half day protocol. Add one day of sequencing on 2500 and you can expect your results in under one week.

I think many people did not expect exome costs to drop so fast. Ilumina's reduction of 80% was welcomed by many groups who wanted to run high numbers of exomes but could not when faced with the high costs and complex workflow without pre-capture pooling that other products had. Processing exomes is getting much easier on all fronts. Nimblegen compare their EZ-cap3 to Agilent in the EZ-cap v3 flyer, they did not include Illumina in thecomparison but they did use Illumina sequencing. It looks like Illumina can't lose whatever exome kit you buy!

A sequenced Nextera exome will cost £250 or $400 with 48 sample kits costing about £4000 and a PE75bp lane about £1000. That's cheaper than some companies are selling their exome or amplicon oligos for!

Nextera capture, how does it work: My lab beta-tested the new kits for exome and custom capture. The workflow was as simple as we expected and the data were high-quality. Nextera sample prep still uses just 50ng DNA and takes about three hours. The exome is the same 62MB but now with 12-plex pre-enrichment sample pooling, and still has two overnight captures.

We are still completing processing on our HiSeq of the full data set, but the initial analysis showed similar on and off-target results when compared to TruSeq, there was a higher duplication rate than we would normally see.

Below are three slides I put together for a recent presentation where I discussed our experiences with Nextera capture. They show that Nextera prep is simple (slide1), that QC can be confusing (slide2) but that results are good and costs are low (slide3). As low as £0.01 per exon!


Does Nextera custom capture kill amplicon-sequencing: You can design custom capture kits using Illumina's DesignStudio (reviewed here). The process is pretty straight-forward and a pool of oligos is soon on its way to you.

Illumina's Nextera capture only requires 50ng of DNA while TruSeq custom amplicon needs 250ng, so Nextera lets you capture more with less DNA. Small Nextera captures run at very high multiplexing on HiSeq 2500 are likely to be far cheaper than low-plexity amplicon screens on MiSeq. If Nextera custom capture can move to 96-plex pre-capture pooling then the workflow gets even easier (see the bottom of this thread for some numbers supporting this idea).

It will be interesting to see how the community repsinds to Nextera capture. If it takes off then Agilent, Nimblegen, Multiplicom, Fluidigm and others are going to be squeezed. There was a recent paper (MSA-cap seq) from the Institute of Cancer Research describing a low-input 50ng prep for Agilent capture, others like Rubicon and Fluidigm are aiming for the low input space, even single cells.

I am sure we have a lot more to look forward to for the second half of 2012.
Although I still don't see a $1 sample prep!


PS: One comment I have sent back to the development team is that the protocol requires the same 500ng library input into capture for exome and custom capture. This means the ratio of target to probe is much higher for custom capture and might be reduced. This would allow users to run custom capture with much less PCR. Alternatively if users stick with a 500ng input to capture then they might be able to increase pooling to much higher levels.

Exome capture uses 350,000 probes for 62Mb and 500ng capture input, giving 1.4ng per 1000 probes.
Custom capture uses 6,000 probes per 1Mb and 500ng capture input, giving 83ng per 1000 probes.
Can we run 96-plex pre-capture pooling?

Another thing I would like to see is the impact of completing only one round of capture. I'd assume we'd see a higher number of off-target reads. However saving a day when sequencing is so cheap for a small custom screening panel could be well worth it.

Wednesday, 11 July 2012

How NGS helped a physician scientist beat his own leukaemia

An amazing story was featured in the New York Times, the article follows Dr. Lukas Wartman from Wash U who is a leukaemia researcher who developed leukaemia himself.

The Genome Institute at Wash U made a concerted effort to find out what was behind Dr Wartman’s disease, performing tumour:normal and tumour RNA-seq analysis. He was fortunate to be included in a research study that was ongoing at Wash U, although that creates all sorts of ethical issues around who can access treatment and who cannot.

From the sequence analysis they found that FLT3 was more highly expressed than usual and could be driving his leukaemia. The drug Sutent had recently been approved for treating advanced kidney cancer, and it does it by inhibiting FLT3. Howwever it had never been used for leukaemia and unfortunately is costs $330 a day. Dr Wartman’s insurers and Pfizer turned him down for treatment.

The doctors he works with chipped in to buy a months supply and the treatment worked. Microscopic analysis showed the blood was clean, flow cytometry found no cancer cells and FISH was clear as well. Dr Wartman is back in remission and I certainly wish him all the best.

I'd love to hear back if circulating-tumor DNA analysis of his plasma is used as a monitoring test.

Tuesday, 3 July 2012

Is genomic analysis of single cells about to get a whole lot easier?

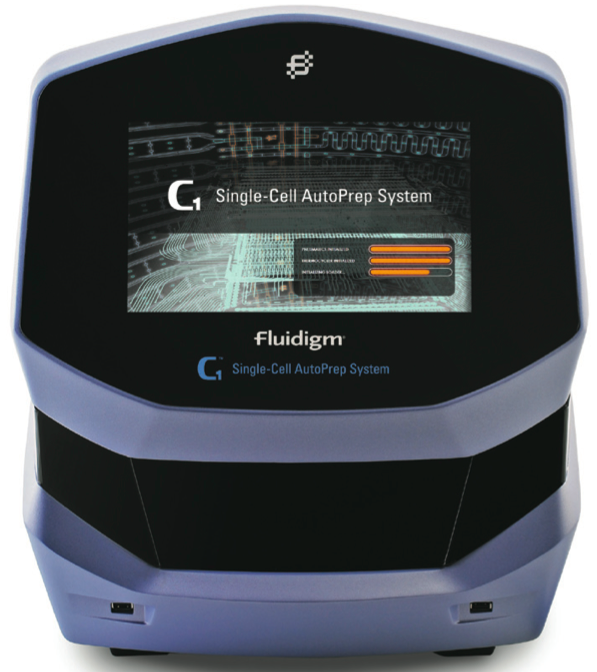
A couple of months ago Fluidigm disclosed the latest addition to their microfluidic chip technology, the C1 single-cell analysis system.

At the disclosure in May the details of the C1 were a little sketchy but the system was planned to take cell suspensions, separate and capture single-cells for nucleic-acid analysis on the Biomark system. The disclosure also hinted at the ability to process single-cells for NGS applications such as transcriptome and copy-number analysis. One rather worrying detail was the fact that the C1 was lumped together with the Biomark and FACS instruments as far as likely cost is concerned.

This means it is probably going to be an expensive instrument, which could limit its uptake. Like many sample prep systems only a few labs will have the capacity to run the box at full tilt. This often makes the investment hard to justify and labs end up sharing systems or using a service.
 

How does the system work: The C1 will take cells in suspension and isolate 96 single-cells. On the system you will be able to stain and image captured cells to determine what sort of cells are present from your population. Cells are then lysed and you can perform molecular biology on the nucleic acids (mRNA RT and pre-amp for now). Finally nucleic acids are recovered from the inlet wells for further analysis.


What is most interesting from my perspective is the ability to tie the C1 to NGS sample prep, either through transcriptome and/or Nextera based library prep, targeted resequencing through Access Array (see our recent paper for ideas) or WGA. If we can prepare libraries with 96 barcodes then I can see some wonderful experiments coming out of work in Flow Cytometry and Genomics labs.

What do I want to do with it: There are so many unanswered questions in biology that are hampered by using data from heterogeneous pools of cells; e.g. Tumours. Being able to dissociate cells, sort by flow cytometry and analyse with NGS is going to be powerful. From my experience of flow cytometry it is nearly always the case that any population of cells can be further subdivided. Being able to perform copy-number, mutation profiling or differential gene expression analysis on these populations is going to help get a better understanding of how much subdivision is required. Being able to capture perhaps 200 circulating tumour cells from a patient and sequence each of these is going to help us understand cancer evolution and metastasis. There are so many possibilities.

The C1 may also help one complex type of experiment that is often not replicated highly enough, low cell number gene expression. Some of my users provide flow sorted cells from populations that vary in number. Being able to run a pool of perhaps 100 cells from each population in a single C1 chip and get high quality GX data is going to remove much of the technical bias and enable more powerful statistical analysis.

Unfortunately this is going to mean lots of sequencing. Even if we can get away with 2M reads per sample for differential gene expression (genes, not exons or isoforms), then we’ll need to run a lane per C1 chip. It is not clear if we be able to generate copy-number analysis of sufficient quality from 0.25x coverage of a genome, although I have some ideas about that I'll post about later.

However for groups working on model organisms where cells can be grown in suspension or dissociated before analysis the C1 could be a phenomenal advance. Imagine individual C.elegans dissociated, cells identified by labelling, tagged by transcriptome library prep and sequenced. Fate-mapping on steroids anyone!

My lab has been working with Fludigm for two and a half years on the Biomark and Access Arrays and we did hear early on about their single-cell projects. I am excited to see a product is now available and look forward to working with the technology. Now all I have to do is find out just how much it will cost to complete an experiment!

Friday, 29 June 2012

Epigenome-seq state-of-the-art: but is hmC worth the effort for everyone?

A couple of recent papers have demonstrated the ability to distinguish between 5-methylcytosine (5mC) and 5-hydroxymethylcytosine (5hmC) using modified bisulfite sequencing protocols. These methods are likely to make a real impact on epigenomics when combined with Bis-seq. By sequencing two genomes, Bis-seq for mC and oxBS-seq or TAB-seq for hmC a fuller picture of methylation will emerge. However it is not clear how important biologically the additional data will be or how much it is worth to researchers.

Trying to complete this kind of experiment today on mammalian genomes requires quite a lot of sequencing muscle. Bis-seq depth guidelines are lacking but most people would aim for 50x or greater coverage. This suggests a 100 fold genome coverage per sample, or an expensive experiment. This could leave the approaches as a niche application for people with a strong focus on epigenetics.

oxBS-seq: The University of Cambridge’s method prevents hmC from being protected in a normal bisulfite conversion. 5-hmC is oxidised such that upon bisulfite treatment the bases are converted to uracils. See Quantitative sequencing of 5-methylcytosine and 5-hydroxymethylcytosine at single-base resolution.

TAB-seq: The University of Chicago’s method differs by protecting 5-hmC from conversion. 5-hmC is protected from oxidation by using beta glucosyltransferase whilst 5-mC’s are oxidised such that during bisulfite treatment they behave as if they were not methylated and are converted to uracils. See Base-resolution analysis of 5-hydroxymethylcytosine in the Mammalian genome.

How to make the methods accessible to all: An area that the two methods may have an impact on more quickly is for capture-based studies in cell lines where material is not limiting. It would be possible to create a PCR-free library and perform capture for an exome (or regions of equivalent genomic size) then follow this capture with bisulfite conversion and sequencing. This MethCap-seq (BisCap, oxBS-Cap or TAB-Cap) method could allow larger sample numbers to be run at the depth required without being too expensive.

We have been testing a Nextera based capture prep in my lab which potentially would allow this to be done on very small inputs, however the method is not yet released and requires quite a bit of amplification.

Another alternative would be to combine the methods with the recent Enhanced Reduced representation bisulfite sequencing (ERRBS) published by Maria E. Figueroa’s group in PLoS Genetics.

Wednesday, 27 June 2012

Has Qiagen bought the Aldi* or Wal-Mart* of DNA sequencing companies?

This update was added on 11 July 2012: An article on GenomeWeb made interesting reading as it talked about the current litigation between Columbia University and Illumina.  In it Thomas Theuringer (Qiagen PR Director) said "We support Columbia's litigation against Illumina, and are also entitled to royalties if we prevail". Maybe the royalties will be worth the reported $50M they paid?


Qiagen has just purchased Intelligent Bio-Systems and is, for now, the new kid on the NGS block. But what does IBS offer, what are the MaxSeq and Mini-20, can they compete against the monster that is Illumina and who owns the rights to SBS chemistry?

The Max and Mini instruments have been on my radar for a year or so now and I really did not think they would compete against Illumina when I first heard about them. I think one has been installed in Europe.

The instruments use technology from the noughties with maximum read lengths of 55bp and 1/3rd the yield of HiSeq. If the instrument and running costs are cheap enough users might be tempted. However a cheap alternative to a gold standard often turns out to be a disappointment.

If the title reads a little harsh then I’ll explain some of my thinking below.

*Aldi and Wal-Mart have a reputation in the UK for cheaper and lower quality products, they offer an alternative to supermarkets like Sainsburys. You should not make any NGS purchasing decisions based on a personal preference of where I like to do my weekly shop!

What did Intelligent BioSystems offer Qiagen and is there space in the NGS market for another player: Qiagen wants to get into the diagnostic sequencing space. However it is not clear if a Qiagen sequencer can compete against Roche, Life and Illumina in the research or clinical space. Clinically Roche already have a strong diagnostics division even if their 454 technology appears to be suffering with the strong competition of MiSeq and PGM. Illumina have thrown their weight behind clinical development and have a reputation for investing in R&D so expect them to become a major player. Life have a reputation for delivering products that work (lets ignore SOLiD) and the continued development of PGM and now Proton has got to keep them in a strong position.

Can Qiagen take any market share: The instrument will have to work robustly, deliver high quality data, be competitive on cost and include bioinformatics solutions. It is not clear what will differentiate the Qiagen instrument from others already widely adopted.

Although I think it is going to be tough for Qiagen it is not impossible; and if there is a $25B diagnostics market (UnitedHealth Group’s personalized medicine paper suggests that the molecular diagnostics market could grow to $25bn by 2021), even a 5% share of this is equates to $1.25B!

What will the Qiagen sequencers look like:
The sequencers offered by IBS make use of sequencing-by-synthesis technology licensed from Columbia university. This technology was published in 2006 by Jingyue Ju in Nicholas Turro’s chemical engineering group at Columbia University. Their PNAS paper describes a system that will be familiar to anyone using Illumina’s SBS. 3-O-allyl-dNTP-allyl fluorophores are incorporated by DNA polymerase, imaged and then cleaved with Palladium catalyzed deallylation ready for the next cycle. They sequenced 13bp in the 2006 paper at almost the same time as Illumina were buying Solexa for $600M.

Perhaps the most intriguing aspect of the technology is that the flowcells are reusable! Sounds great, but will clinical labs see this as a benefit over disposable consumables? I think not as there is too much risk a sample will become contaminated. The same goes for removing the need to barcoding on Mini-20 by using a 20 sample carousel. Barcoding is useful in labs just for sample tracking even if you end up doing a run in a single lane/flowcell.

Max-seq: In the brochure they claim that “thousands of genomes have been sequenced utilizing 2nd generation technologies, such as the MAX-Seq”, I would argue that 10,000’s of genomes have been sequenced but I am not aware of a single Max-seq genome to date.

Library prep uses ePCR bead-based or DNA nanoball (Rolony) methods. Libraries are loaded onto a flow-cell and sequenced with SBS chemistry. The instrument has dual-flowcells and each will generate 100M reads per lane in single or paired-end format at 35 or 55bp length, with >80% of bases being Q30 or higher.

The Azco website suggests that the Max-seq is thousands of dollars cheaper than a SOLiD or HiSeq instrument, and that run costs are 35% cheaper than Illumina or ABI. If you only get 25-50% of the data this make the system cost more like twice as much per run for lower quality data and much shorter reads.

Mini-20: I am not certain the Mini-20 actually exists yet. The brochure on the Azco website has a picture of the Max-seq with a line drawing of a flowcell carousel. The carousel should allow loading up to 20 flowcells and run up to 10 samples per day (SE35bp). A flow cell will generate 35M reads in single or paired-end format at 35 or 55bp length, with >80% of bases being Q30 or higher and 4Gb per flowcell.

Cost per run is predicted to be about $300 per flowcell. However it is not clear what the price would be if you wished to dispose of the reusable flowcells after a single use.

Those numbers do not add up to me but they must have made sense to Qiagen.

Friday, 22 June 2012

Improving small and miRNA NGS analysis or an introduction to HDsRNA-seq

Small RNA biases have been very well interrogated in a series of papers released in the last 12 months. The RNA ligation has been shown to be the major source of bias and the articles discussed in this post offer some simple fixes to current protocols which should allow even better detection, quantification and discovery in your experiments.

Small RNA plays an important regulatory role and this has been revealed by almost every method possible that can be used to measure RNA abundance; northern, real-time qPCR, microarrays and more recently next-generation sequencing. These methods do not agree particularly well with each other and the most likely candidate issue is technical biases of the different platforms.

Even though it has its own biases, small RNA sequencing appears to be the best method available for several reasons, it does not rely on probe design and hybridization, you can discriminate amongst members of the same microRNA family and you can detect, quantitate and discover in the same experiment (Linsen et al ref).

Improving small RNA sequencing: As NGS has been adopted for smallRNA analysis focus has appropriately been made on the biases in library preparation. Nearly all library prep methods use ligation of RNA adapters to the 3’ and 5’ ends of smallRNAs using T4 RNA ligases, before reverse transcription from 3’ adapters and amplification by PCR. However RNA ligase has strong sequence preferences and unless addressed these lead to bias in the final results of sequencing experiments.

All four of the papers below show major improvements to RNA-seq bias for small RNA protocols.

I particularly like the experiments performed in the Silence paper using a degenerate 21-mer RNA oligonucleotide. Briefly the theory is that a 21-mer degenerate oligo has trillions of possible sequence combinations and that in a standard sequencing run each sequence should appear no more than once as only a few million sequences are read. The results from a standard Illumina prep showed strong biases for some sequences that were significantly different from the expected Poisson distribution, and where almost 60,000 sequences were found more than 10 times instead of once as expected (the red line in figure A from their paper reproduced below). When they used adapters where four degenerate bases were added to the 5′ end of the 3′ adapter and to the 3′ end of the 5′ adapter, they achieved results much closer to those expected (blue line).


I don’t think we should be too worried about differential expression studies as long as the comparisons used the same methods for both groups, the results we have are probably true. However we may well have missed many smallRNAs because of the bias and our understanding of biology is likely to be enhanced by these improved protocols.


The recent papers:

Jayaprakash et al NAR 2011: showed that RNA ligases have “significant sequence specificity” and that “the profiles of small RNAs are strongly dependent on the adapters used for sample preparation”. They strongly suggest modifications to current protocols for smallRNA library prep using a mix of adapters, "the pooled-adapter strategy developed here provides a means to overcome issues of bias, and generate more accurate small RNA profiles."

Sun et al RNA 2011: "adaptor pooling could be an easy work-around solution to reveal the “true” small RNAome."

Zhuang et al NAR 2012: showed that the biases of T4 RNA ligases is not simply sequence preference but affected by structural features of RNAs and adapters. They suggested "using adapters with randomized regions results in higher ligation efficiency and reduced ligation bias".

Sorefan et al Silence 2012: demonstrate that secondary structure preferences of RNA ligase impact cloning and NGS library prep of small RNAs. They present “a high definition (HD) protocol that reduces the RNA ligase-dependent cloning bias” and suggest that “previous small RNA profiling experiments should be re-evaluated” as “new microRNAs are likely to be found, which were selected against by existing adapters”, a powerful if worrying argument.

Monday, 18 June 2012

Even easier box plots and pretty easy stats help uncover a three-fold increase in Illumina PhiX error rate!

One of the things I wanted to do with this blog was share things that make my job easier. One of the jobs I often have to do is communicate numbers quickly and effectively and a box plot can really help. I also have the same kind of troubles most people face with statistics, I find it hard! In this post I will discuss the GraphPad Prism package from GraphPad. This allows you to use stats confidently and make lovely plots (although annotating them is a nightmare). Recently the statisticians in our Bioinformatics core gave a short course in using GraphPad Prism.  I thought I'd explain the box plot in a little more detail and tell you a bit about GraphPad.

Previously I had shown how to create a box plot using Excel. I went down this route because I did not have time to learn a new package and Excel is available almost everywhere. However the result is less than perfect and it is hard work, indeed one major reason for writing the previous blog post was so I had somewhere to go next time I needed to create a plot! Statisticians like box plots as they can get across a lot more than just the mean and also say something about the size of the population being investigated.

Explaining box plots: A box plot is a graphical representation of some descriptive statistics; generally the mean and one of the following; standard deviation, standard error or Inter Quartile Range. A dot box plot is a version that allows these figures to be represented along with all the data points which allows the size of the population to be clearly seen. This helps enormously when comparing sample groups and deciding if a change in mean is statistically significant or not.

Dot box plots rule!

In figure 1 very similar mean and standard error are plotted with each dot representing a sample, see how the removal of some data does not significantly affect the "results" but seeing the data allows you to make a call on how much you are willing to trust it.


Figure 1

In figure 2 you can clearly see that there appear to be some "outliers" in group 2 but these have no affect on the results as the number of measurements is so high compared to group 1. Deciding if any "outliers" are in group 1 is much harder as the number of samples is so much lower. Removing outliers is really hard, and our statisticians generally advise against it.

Figure 2

GraphPad Prism: The software costs about $300 for a personal license. It might be a lot when budgets are tight but an academic license is not so expensive when shared across a department or institute. I’d certainly encourage you to take the plunge. It very quickly allows you to produce plots like the ones in this post as well as run standard statistical tests, and a whole lot more I won't go into. Take a look at their product tour if you want to find out more.

PhiX error rates: I used GraphPad to investigate an issue I had suspected for a while. We have been seeing a bias in the error rate on Illumina sequencing flowcells where lane one appeared to be higher than other lanes. Whilst the absolute numbers are not terrible and all lanes pass our QC there may be a real impact on results if this is not taken into account; mutation calling single lane samples and comparing tumour to normal for instance.

I took one months GAIIx data (8 flowcells) and plotted error rate for each lane. Entering the data into GraphPad is the most annoying bit and I usually copy and paste from Excel. However generation of the statistics and plots (figure 3) took about three minutes from start to finish.

A one way ANOVA with a Bonferroin correction showed how significant the differences were, with a very significant difference between lanes 1&2 and the rest. In fact there appears to be more of a gradient across a flowcell as lane 2 is affected, but at a lesser degree to lane 1.

A 2 way ANOVA allowed me to determine that in this data set lane accounted for 80% of the variance and instrument only 2.5%.

Figure 3
The biggest headache with GraphPad is the woefully inadequate annotation of graphs. Quite simply you will have to get an image out of the software and into Illustrator or PowerPoint. I guess if they are making the stats easy we should not complain too much.

I am using GraphPad on a weekly basis and for most reports where I have to summarise larger datasets. Why don't you give it a try.

PS: I'll let you know what Illumina say about the error rates. Please tell me if you've seen similar.